

Abhishek Dilip Dudhal is an alumnus of Veermata Jijabai Technological Institute. Sagar Nilay Mahajan works with PwC India.
Economic analysis has been evolving during the past few decades with the increase in computational power, which has given rise to a variety of mathematical tools such as statistical modelling and machine learning algorithms. These advancements are playing a major role in economic research. Extensive use of these technologies can aid in formulating a mathematical relationship between economic equality and economic freedom. It will provide a new perspective to the classical political and socio-economic debate. Economic equality is defined as the situation in an economy in which income, goods and resources are distributed equally. Gini Index [1] is a statistical dispersion used in measuring wealth distribution of a nation. It is a measure of inequality. Qualitatively, equality and inequality are inverses of each other. Increase in inequality implies a decrease in equality, and vice-versa. Economic freedom is defined as the freedom to produce, trade and consume any goods and services acquired without use of force, fraud or theft. Economic Freedom Index [2], which measures impact of freedom and the free market in the world, has been taken into consideration for measuring economic freedom. Gerald W. Scully [3] claims that “economic freedom reduces income inequality”. John R. Carter’s [4] regression analysis tried to contradict the result obtained by Scully by saying that economic freedom and economic equality have negative relation. Allen L. Webster [5] supports Carter’s study, but he has considered the data only from various states in the USA. Regression analysis and curve fitting are widely used statistical tools for analysis of correlation between two variables. This paper uses polynomial regression curve fitting for comparative study between Economic Freedom Index and Gini Index of various countries. Our research aims to verify the above research works with updated values of Gini Index and Economic Freedom Index while taking into consideration various countries.
SOURCE OF DATA
A. Economic Inequality Index
The income and wealth inequality data i.e. Gini Index is sourced from Central Intelligence Agency’s ‘The World Fact book’ [6]. This dataset contains income inequality data of 150 countries expressed as Gini Index. In general, Gini Index can range from 0 to 100. If income and wealth in a country is distributed with perfect equality, Gini Index will be equal to 0, while perfect unequal distribution of income and wealth in a country will be represented by Gini Index equal to 100. In this dataset, it is observed that Gini Index of the countries vary from 21.5 to 63.2. B. Economic Freedom Index The dataset of Economic Freedom Index is prepared by The Wall Street journal and The Heritage foundation [7]. This dataset contains data of 186 countries. In general, Economic Freedom Index can range from 0 to 100. Complete economic freedom is represented by value of the index equal to 100 and no economic freedom is represented by value of index equal to 0. In the dataset, it is observed that Economic Freedom Index of the countries vary from 5.2 to 90.2.
DATA PREPROCESSING
As the sources of the two indices are different, they are integrated into a unified dataset. Different naming and coding convention for countries are resolved using ISO 3166 standards [8]. For some ISO 3166 countries, either one or both of the indices were not available. Such data points are treated as inconsistent data and hence are dropped from the dataset. Data for fragile countries are considered as noise for such analysis. Such economically fragile countries are dropped from the dataset. The preprocessed dataset consists of 69 countries. The Gini Index for these 69 countries varies from 24.6 to 53.7, while The Economic Freedom Index for these countries varies from 25.2 to 90.2. This preprocessed dataset consists of countries with different economic ideologies like Capitalism, Socialism to Communism.
METHODOLOGY FOR CURVE FITTING
A. Selection of Variables for Regression
Univariate Regression curve fitting [9] is used to model the relationship between a dependent variable and an independent variable. In this research, Gini Index is taken as the independent variable say, x and Economic Freedom Index is taken as the dependent variable say, y. There are various types of regression viz. linear regression [10], polynomial regression [11], exponential regression [12] and logistic regression [13] being the most widely used forms. We have tested our results against all the four mentioned types.
B. Significance of Correlation Coefficient
The correlation coefficient is a quantitative measure of relationship between variables. Pearson’s correlation coefficient [14] is widely used and is calculated as
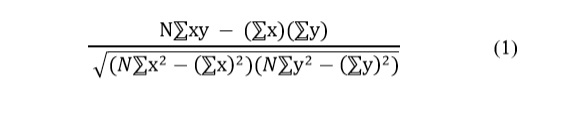
Where, N is the total number of data points, ⅀xy is sum of products of dependent and independent variables, ⅀x is the sum of values of independent variables, ⅀y is the sum of values of dependent variables, ⅀x2 is sum of squared values of independent variable, ⅀y2 and is sum of squared values of dependent variable. When correlation coefficient is equal to zero, it implies that there is no relation or dependence between the variables.
C. Significance of Standard Error
The standard error [15] is calculated as
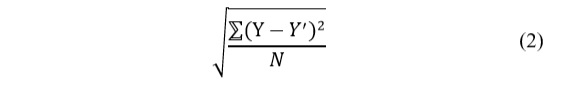
Where, N is the total number of data points, Y is the actual value, ????′ is the predicted value.
D. Selection of Regressor
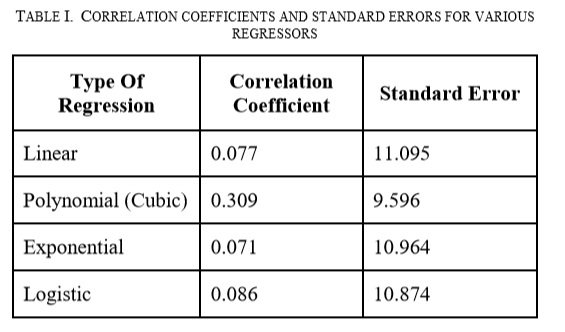
The summary of obtained correlation coefficients and standard errors on applying different types of regression can be found in Table I. Out of these, linear, exponential and logistic regression give a correlation coefficient nearly zero, implying no relationship between the two variables. Only cubic polynomial regression gives a correlation coefficient of 0.309, suggesting some correlation between Economic Freedom Index and Gini Index. By comparing standard error values from Table I, it can be inferred that polynomial regressor is the best choice due to least error amongst other regressors. Hence, polynomial regression is used for further analysis.
RESULTS
A. Interpretation of Scatter Plot
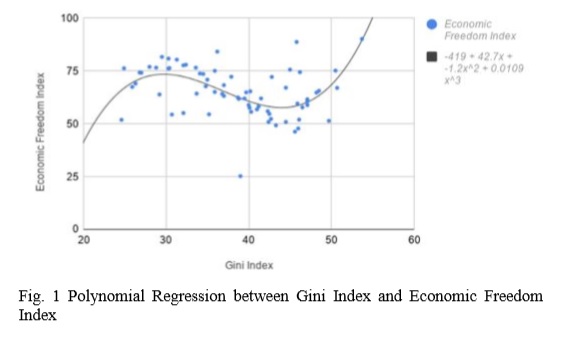
The scatter plot (Fig. 1) can be divided into three regions on the basis of Gini Index. The first region ranging from 0 to 30.42, consists of countries mostly with highly socialist or highly communist approach towards economy like Ukraine (24.6, 51.9), Sweden (24.9, 76.3), Denmark (28.8, 76.6), Netherland (30.3, 76.2) etc. The second region ranging from 30.42 to 44.97, is mostly composed of countries with balanced economic approach between Socialism and Communism. These countries are underdeveloped or economically developing like Pakistan (30.7, 54.4), Bangladesh (32.1, 55.1), India (35.2, 54.5) etc. The third region is composed of highly capitalist countries like USA (45. 75.5), Singapore (45.8, 88.8), Hong-Kong (53.7, 90.2) etc.
B. Regression Model
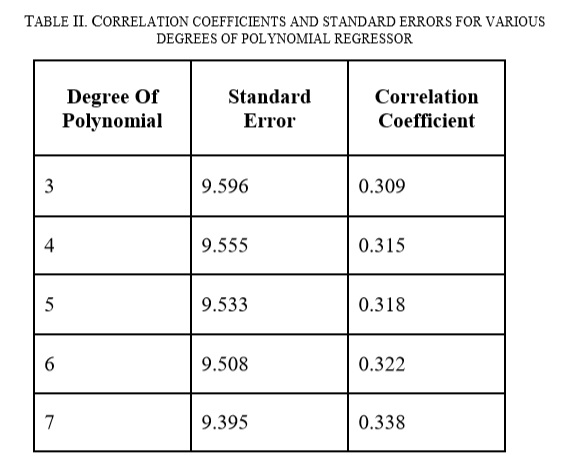
Observations found in Table II indicate that by varying the degree of the polynomial regressor from 3 to 7, there is an insignificant change in correlation coefficient and standard error. Also, for polynomial of degree 7 and above, overfitting occurs. Hence for simplification of further study, cubic regression model is chosen. General equation for cubic polynomial regression curve is
???? = ????0 + ????1???? + ????2????2 + ????3????3 …(3)
Where, X is independent variable, Y is dependent variable and ????0,????1,????2 and ????3 are constants. Model obtained by applying cubic regression on preprocessed data is
???? = −419 + 42.7???? − 1.2????2 + 0.0109????3… (4)
Where, X is Gini Index and Y is Economic Freedom Index.
C. Significance of First Order Derivative
Rate of change in the Economic Freedom Index with respect to Gini Index can be studied by differentiating equation (4).
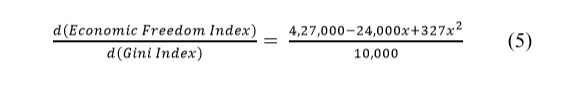
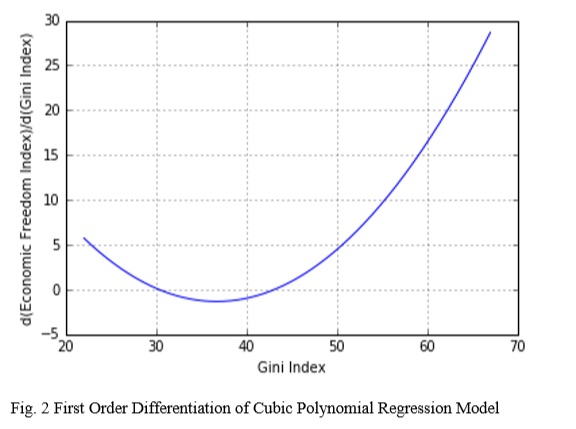
The graph of above equation (Fig. 2) suggests that when the value of Gini Index is between 30 and 45, the value of the first order derivative, or in other words, change in Economic Freedom Index with respect to Gini Index is negative. This negative value of the slope represents that the economic freedom and economic inequality move in opposite direction. As Economic equality is assumed as qualitative inverse of economic inequality, it suggests that in this range, economic freedom and economic equality moves in the same direction. At all the other points excluding the above range of Gini index from 30 to 45, the rate of change of Economic Freedom Index with respect to Gini Index is positive. This positive value of the first order derivative represents that economic freedom and economic inequality are moving in same direction. In effect, it means that economic freedom and economic equality are moving in the opposite direction.
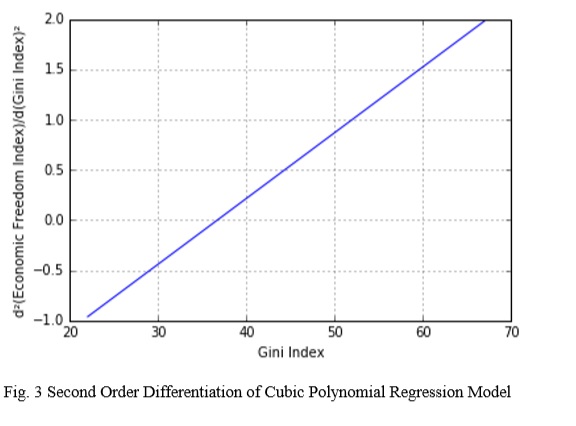
D. Significance of Second Order Derivative
Second order differentiation of cubic regression model is used to study the variation in first order derivative of the cubic regression model with change in Gini Index. Second order differentiation of the cubic regression model is given as below,
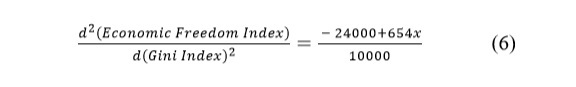
As the slope of second order differentiation is always positive at all points (Fig. 3), it can be inferred that the first order derivative or simply, the rate of change of Economic Freedom Index with respect to Gini Index, varies rapidly with a small change in Gini Index. In effect, this implies that a small increase in Gini Index causes a large variation in Economic Freedom Index.
CONCLUSION
Through regression analysis and polynomial curve fitting, this paper has given a mathematical shape to a well-known debate about economic freedom and economic equality. This study supports the results obtained by Carter and Webster that economic equality and economic freedom cannot go together. This result is valid for all the values of Gini Index except for the range from 30.42 to 44.97. This range includes developing countries and countries with balanced economic ideologies and supports Scully’s claim that economic freedom and economic equality can move in the same direction. Hence, it is concluded that there is no fixed one directional relationship between economic freedom and economic equality which can be applied to all countries.
THE WAY FORWARD
The regression analysis conducted in this paper compares the economic indices of various countries. But, the results obtained from such analysis may not be consistent with the policies drafted by the local governments within a country due to variation in their social and political conditions. Hence, further analysis can be done by considering economic indices of appropriate regions within a country.
REFERENCES
[1] L. Ceriani and P. Verme, “The origins of the Gini index: extracts from Variabilità e Mutabilità (1912) by Corrado Gini,” The Journal of Economic Inequality, vol. 10, no. 3, pp. 421–443, Oct. 2011.
[2] M. A. Miles, K. R. Holmes, and M. A. OGrady, 2006 index of economic freedom. Washington, DC: Heritage Foundation, 2006.
[3] G. W. Scully, “Public Choice,” Public Choice, vol. 113, no. 1/2, pp. 77–96, 2002.
[4] J. R. Carter, “An Empirical Note on Economic Freedom and Income Inequality,” Public Choice, vol. 130, no. 1-2, pp. 163–177, Jun. 2006. [5] A. L. Webster, “The Relationship Between Economic Freedom And Income Equality In The United States,” International Business & Economics Research Journal (IBER), vol. 12, no. 5, p. 469, 2013.
[6] Central Intelligence Agency. [Online]. Available: https://www.cia.gov/library/publications/the-worldfactbook/rankorder/rawdata_2172.txt. [Accessed: 23Feb-2018].
[7] “Downloads,” Download Index of Economic Freedom Data, Maps and Book Chapters. [Online]. Available:https://www.heritage.org/index/excel/2018 /index2018_data.xls. [Accessed: 23-Feb-2018].
[8] “Country Codes – ISO 3166,” ISO 3166 Country Codes, 22-Dec-2017. [Online]. Available:
https://www.iso.org/iso-3166-country-codes.html. [Accessed: 23-Feb-2018].
[9] L. M. Mezei, Practical spreadsheet statistics and curve fitting for scientists and engineers. Englewood Cliffs, NJ: Prentice Hall, 1990.
[10] D.N. Gujarati, “Two variable regression model: The problem of estimation” in Basic econometrics. New York: McGraw-Hill, 1978, pp. 65-76
[11] D.N. Gujarati, “Multiple regression analysis: The problem of estimation” in Basic econometrics. New York: McGraw-Hill, 1978, pp. 226-229
[12] D.N. Gujarati, “Nonlinear regression model” in Basic econometrics. New York: McGraw-Hill, 1978, pp. 565-566
[13] D. G. Kleinbaum and M. Klein, Logistic regression: a self-learning text. New York: Springer, 2011.
[14] S.C. Gupta, V.K. Kapoor “Correlation,” in Fundamentals of mathematical statistics. Delhi: Sultan Chand & Sons, 1970, pp. 10.2–10.6. [15] D.M. Lane, “Regression” in Introduction to Statistics, pp.473-476 [E-book] Available: http://onlinestatbook.com/Online_Statistics_Educatio n.pdf
Abhishek Dilip Dudhal is an alumnus of Veermata Jijabai Technological Institute.