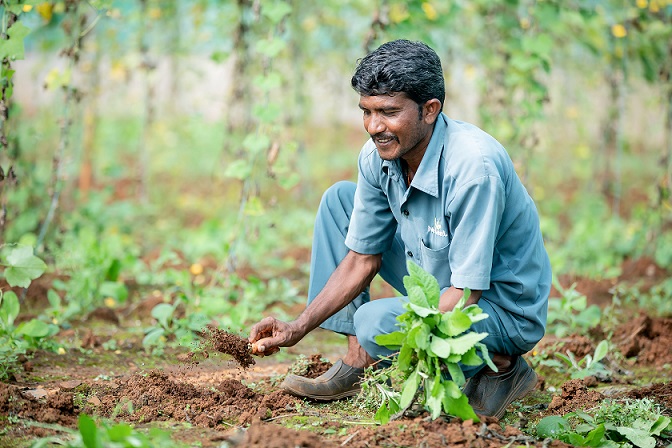
Situational Analysis of Indian Agriculture:
Agriculture in India is in a crisis due to multiple factors. High cost of cultivation, low returns, climate change, spurious inputs and many other factors leading to this crisis.
Agriculture is the primary source of livelihood for about 58% of India’s population and contributing to 18% of India’s GDP. Gross Value Added by agriculture, forestry, and fishing was estimated at Rs. 19.48 lakh crore (US$ 276.37 billion) in FY20. Share of agriculture and allied sectors in gross value added (GVA) of India at current prices stood at 17.8 % in FY20. In 2020-21, the growth rate of agriculture is estimated to be 3.4%. While the contribution of Sector to Gross Value Added (GVA) declined from 18.3% to 17.8% between 2014-15 and 2019-20. Following graphs shows year on year GVA of agriculture and allied sectors:
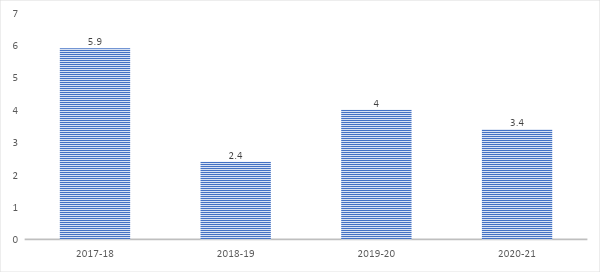
Graph-I: Growth rate of GVA at base price in %
Source: Economic Survey 2021-22
Indian agriculture is predominantly managed by small and marginal farmers. 85 per cent of India’s farmers operate less than five acres of land, half of which in many parts of India may be dry / rain-fed and only a part of their income comes from farming activity now with others coming from wages, off-farm and non-farm activities. Small farmers contribute 51 per cent of agricultural output with 46 per cent of operated land, and a much higher share (70 per cent) in high-value crops. The following graphs shows the percentage of operational holdings and percentage of operation area of various categories of farmers:
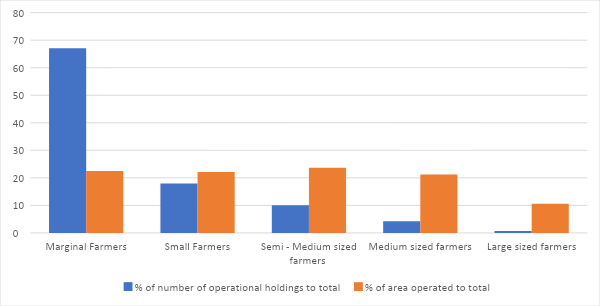
Graph-II: Economic Categorisation of Indian Farmers
Source: Agriculture census 2015-16
Soil health, an attribute of several physical, chemical and biological processes, is showing signs of fatigue due to intensive cultivation, over-mining of nutrients by crops with lesser replenishments through organic and inorganic sources. The constant decline in soil health is often cited as one of the reasons for stagnating or declining yields.
A national database on land degradation prepared by the Indian Space Research Organisation (ISRO) in 2018-19 shows that 97.85 million hectares (mha), or 31.6 per cent of India’s total arable and non-arable land, suffers from various forms of degradation with water erosion being its chief contributor in 83 mha (68.4 per cent).
Water erosion results in loss of organic carbon, nutrient imbalance, soil compaction, decline in soil biodiversity, and contamination with heavy metals and pesticides.
As per the estimations of National Academy of Agricultural Sciences (NAAS), the annual soil loss rate in our country is about 15.35 tonnes per ha, resulting in loss of 5.37 to 8.4 million tonnes of nutrients. The loss of soil has another immediate major impact on crop productivity.
The eroded soil causes siltation of reservoirs and reduces reservoir capacity which is estimated 1 to 2 per cent annually which further impact irrigation in its command area. Major rainfed crops in India suffer an annual production loss of 13.4 million tonnes due to water erosion which amounts to a loss of Rs 205.32 billion, according to NAAS estimates.
Around 1.07 mha is under physical degradation due to waterlogging. A total of 0.88 mha area is under permanent surface inundation and about 12.53 mha of rainfed soil remains fallow due to temporary water logging during kharif.
Waterlogging, which damages soil by causing salinisation, results in annual loss of 1.2 to 6.0 million tonnes of grain in India. Besides India’s huge tract of fertile soils also get affected due to diversion for non-agriculture purposes.
Chemical degradation of soil health based on parameters like salinisation (alkalinisation), acidification, soil toxification through chemicals, and depletion of nutrients and organic matter and other nutrient input related issues. Around 6.74 mha are under salt affected soils comprising of 3.79 mha under high sodicity (presence of sodium, pH > 9.5) and about 3 mha under high salinity.
In terms of pH value that major part of country is moderately Alkaline. Some part of North India like Himachal Pradesh, J&K (undivided), western Uttarakhand and East India like Odisha, Jharkhand, North Eastern and western coast peninsula are high or moderately acidic. About 11 mha of arable land suffers from acute soil acidity (pH < 5.5) with very low productivity.
Water is a critical input for agriculture production and plays an important role in food security. Traditionally farmers depended upon rainfall, rivers, lakes, open wells, farm ponds, canals, and reservoirs for water. Average rainfall in India is 1,170 mm, but it is highly erratic and unevenly distributed across the country with high-intensity storms interspersed with long dry spells. This affects the agricultural production. Following are the key indicators of irrigation:
| Parameter | Details |
| Agriculture land, mha | 181.9 |
| Net sown area % | 77 |
| Gross Irrigated area, mha | 68.2 |
| Irrigated area under food crops % | 55 |
| Micro – Irrigation, mha | 10.254 |
| Cropping intensity % | 138 |
Table-I: Key indicators for Irrigation
Source: Agricultural statistics at a glance, MoA&FW, GOI, (2018-19)
More than 60% of irrigated agriculture is depends on the ground water. Farms irrigated with groundwater have twice the crop water productivity of those that rely on surface-water alone. This is largely because the resource allows farmers greater control over when to irrigate their fields and how much water to use each time.
Recent assessment of the ground water table in 6,584 units (blocks) across states in India by the Central Ground Water Board (CGWB) in 2017 reveals that 1034 units are overexploited, 253 are critical and 681 are semi critical. Indiscriminate withdrawals, arid climate and poor aquifer properties are limiting ground water replenishment.
Irrigation by tube well has increased due to the availability of electricity for pumping water through submersible pumps. Irrigation by canals and dug wells are almost constant and tanks are limited and not preferred as shown in Graph -III.
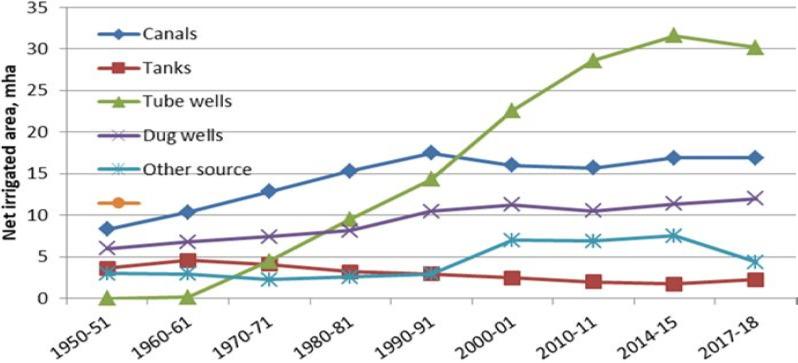
Graph-III: Trends in Irrigation by sources
Source: Agricultural statistics at a glance, MoA&FW, GOI, 2018-19
Micro-irrigation (MI) technologies like drip and trickle systems have also been adopted by the farmers; sprinkler irrigation is now used for 5.476 mha and drip irrigation for 4.729 mha. The micro-irrigation technologies such as drip and sprinkler are the key interventions in water-saving and improving crop productivity. The major crops under micro irrigation are fruits and vegetables (banana, papaya, mango, grapes); and plantation crops.
Rain-fed agriculture is comprised of 86 mha and water management and timely sowing are major constraints. Rain-fed agriculture is comprised of 86 mha and contributes about 60% of the cropped area and 55.7% of the total Nutri-cereals. More than 80% of the pulses and oilseeds and a major part of horticulture and animal husbandry are produced in rain-fed regions. Coarse cereal, pulses, oilseeds, cotton, and rice are grown under rain-fed agriculture.
Groundwater depletion in India is a result of water, energy, and food policies that have given rise to a nexus where growth in agriculture has been supported by unsustainable trends in water and energy use. India is the world’s largest user of groundwater, with an annual draft of 250 km3 (Aeschbach-Hertig and Gleeson 2012).
Since the 1970s, there has been a rapid increase in the area under groundwater irrigation. There are roughly 20 million irrigation wells in India (GOI 2017), the highest number anywhere in the world. Groundwater-led irrigation was instrumental in the success of the Green Revolution in India, mostly because of its accessibility and reliability as compared to canal irrigation (Shah 1993). The growth in irrigation through tube wells after the Green Revolution has increased compared to other irrigation sources. About 24.27 million diesel and electric operated irrigation pumps are estimated to be in use and more than 55% of the area under food grains is irrigated (2017–18).
Rural electrification, especially electrification of pump sets, became an important policy priority in the late 1960s. This shift happened in response to a series of droughts in India in the early to mid-1960s and followed the discourse on national food self-sufficiency through small-scale groundwater irrigation.
By the early 1970s, there were more than a million wells with electric pumps in the country (Palit and Bandyopadhyay 2017). Easy availability of credit, sharp declines in well drilling costs, and the availability of Green Revolution technologies that ensured high returns on irrigation led to massive private investments in groundwater wells (Shah 1993).
After the Green Revolution, agricultural electricity consumption went up rapidly (GOI Ministry of Statistics and Programme Implementation 2020). Around the turn of the millennium, the World Bank estimated farm power subsidies to be around “USD 6 billion a year, about 25 percent of India’s fiscal deficit, twice the annual public spending on health or rural development, and two and a half times the yearly expenditure on irrigation” (Monari 2002). The following graphs shows growth in agriculture electricity consumption in India.
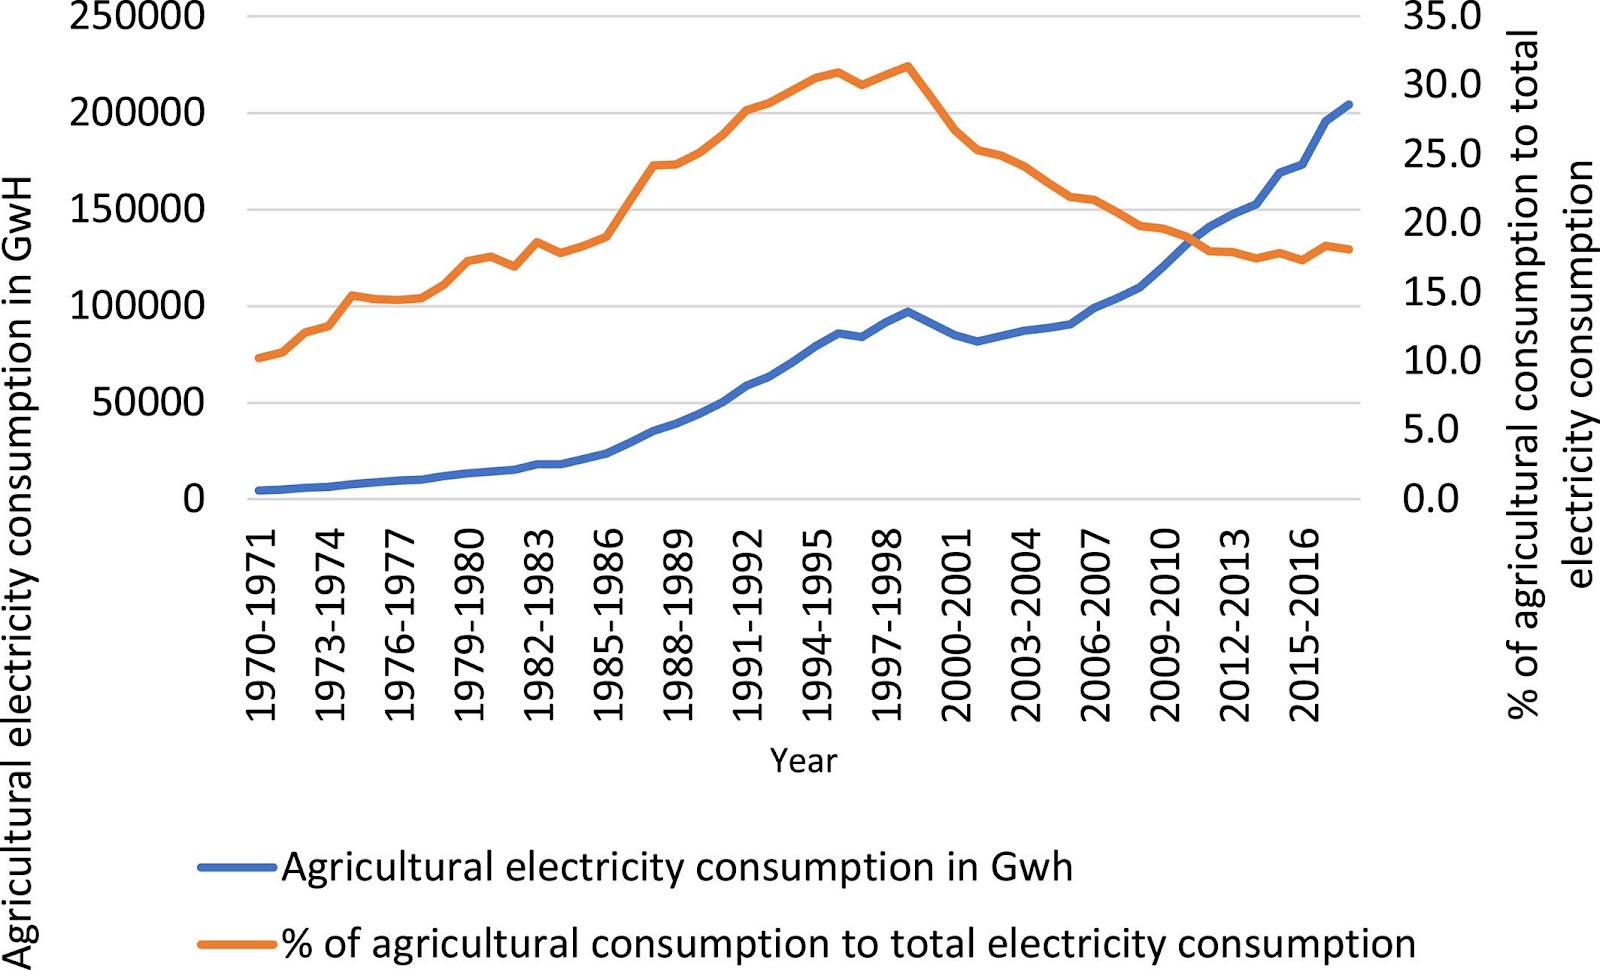
Graph-IV: Trends in electricity consumption in India.
Source: Applied Eco Perspectives Pol, Volume: 44, Issue: 1, Pages: 394-410, First published: 23 November 2020, DOI: (10.1002/aepp.13123)
Seed is the basic and most critical input for sustainable agriculture. The response of all other inputs depends on quality of seeds to a large extent. It is estimated that the direct contribution of quality seed alone to the total production is about 15 – 20% depending upon the crop and it can be further raised up to 45% with efficient management of other inputs.
The private sector has started to play a significant role in the seed industry over the last few years. At present, the number of companies engaged in seed production or seed trade is of the order of 400 or 500. However, the main focus of private seed companies has been on the high value low volume seeds and market for low value high volume seeds of cereals, pulses and oilseeds is still dominated by the public sector seed corporations.
Private sector companies have a significant place mainly in the case of maize and sunflower and cotton. However, in the case of vegetable seeds and planting materials of horticultural crops, the private sector is the dominant player. As the private sector has not been enthusiastic about entering into seed production of high-volume low margin crops of wheat, paddy, other cereals, oilseeds and pulses, the public sector seed corporations will continue to remain dominant in cereals, pulses and oilseeds for many more years to come.
Farmers are cultivating more than 500 crops in the country; more than 50 crops are grown in mixed cropping in rainfed areas. More than 600 public institutions and 400 private seed companies’ together serve seed needs of only 12+ field crops and 11+ vegetable crops in the country. Informal seed system is mostly out of public investments and R&D
The Indian fertilizer market showed a growth of 22.6% in last 5 years during 2016-2021, however production of fertilisers in India has negligible growth of 3.78% during 2016-2021, resulted more dependency on import of fertilizers, which is increased by 48.22% in FY’ 2020-21 from FY’ 2016-17. In spite of depending on import for huge quantity of fertilizers, farmers hardly faced any shortage of fertilizers in these 5 years. As, a result the demand of fertilizers has witnessed continuous growth YOY in the past several years. Looking forward, the Indian fertilizer market is expected to grow at a CAGR of 2.91% during 2021-2026 and to touch a level of 70.64 million tons by 2025-26. Following graph shows trends in fertiliser production, imports and sales.
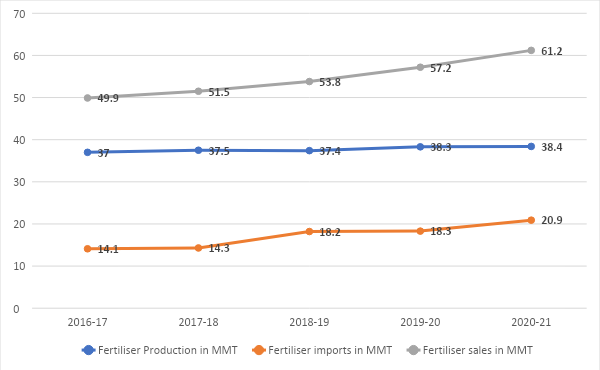
Graph – V: Trends in fertiliser production, imports and sales
Source: Fertilisersinida.com
Fertiliser subsidy in India has succeeded in achieving its objective of increasing fertiliser consumption in agriculture and hence, raising food production, but it has also led to some problems because some fertiliser products have been priced very low. There are two key issues with regard to fertiliser subsidy in India:
(1) Rising amounts of fertiliser subsidy in the budget and financial sustainability
(2) Extremely low prices of urea leading to imbalanced use of N, P and K, as also misuse of urea
Subsidy given by Central government on various fertilisers increased from Rs. 891 crores during early 1980s to a record Rs 1,38,500 crore in 2020-21. Much of the subsidy was spent on urea at Rs 99,500 crore followed by P&K fertilisers at Rs 39,000 crore. Following graph shows the trend in fertiliser subsidies:
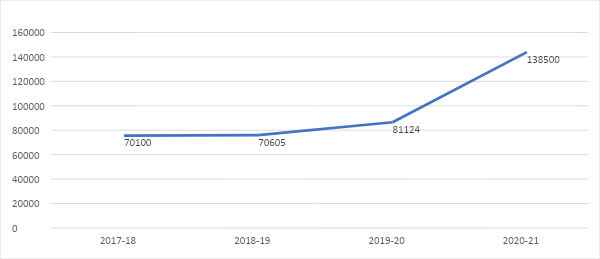
Graph: VI: Trends in fertiliser subsidy
Source: DBT scheme, Ministry of Agriculture and Farmers welfare
The ideal n-p-k use ratio is 4:2:1, but has gone from 6:2.4:1 in 1990 to 6.7:2.7:1 in 2016, according to a report by Fertilizer Association of India. The situation is grimmer in agriculturally important states like Punjab and Haryana where the ratio is as high as 31.4:8.0:1 and 27.7:6.1:1 respectively.
Of the total 525 districts of the country, about 292 districts account for 85 per cent of total fertiliser use. The pattern of use of fertiliser also varies widely among crops. Fertiliser use in potato, sugarcane, cotton, wheat and paddy is quite high at 347.2 kg/ha, 239.3 kg/ha, 192.6 kg/ ha, 176.7 kg/ha and 165.2 kg/ha respectively.
Even among these crops, there is excessive use of nitrogenous fertiliser. Excessive use of urea is further deteriorating the soil. In 2014-15, of the total 485 million tonnes fertiliser used in the country 306 million tonnes was urea.
The declining fertiliser response ratio is an indicator of declining responsiveness of soil fertility to fertiliser application. Fertiliser response ration is declined from 13.4 in 1970 to 2.7 in 2015. The declining fertiliser response ratio in Indian agriculture is due to inadequacy and imbalance in fertilser use, increasing multi nutrient deficiency, lack of farmers awareness about balanced plant nutrition and poor crop management.
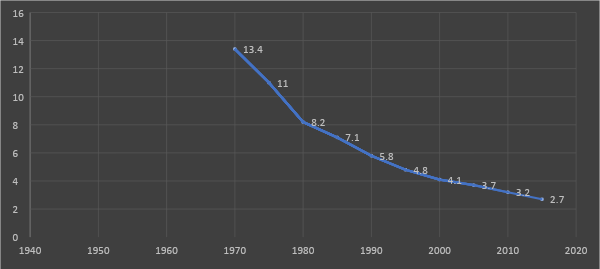
Graph: VII: Fertiliser response ration
Source: Chaudhari et al., 2015
Pesticides are substances (natural or manmade) used to control pests, weeds, and diseases in plants in various agronomic practices. Pesticides have become a key tool for plant protection and improvement of crops in the process of agricultural development. There are 292 pesticides registered in India, and it is reported that 104 pesticides are still being produced/used in the country despite being prohibited in two or more nations around the world. Out of total insecticides used for pest management in India, 50% are diverted to cotton pest management.
Insecticides, fungicides and herbicides are used in India, with insecticides forming the highest share. India is among the largest producers of pesticides in the world. According to a report by database Research and Markets, the Indian pesticides market was worth Rs 197 billion in 2018. The market is further projected to reach a value of Rs 316 billion by 2024, growing at a Compound Annual Growth Rate of 8.1 per cent during 2019-2024.
The total as well as per hectare consumption of pesticides in India shows a significant increase after 2009-10. The recent increase in pesticide use is said to be because of higher use of herbicides as cost of manual weed control has risen due to increase in agricultural wages. Total pesticide consumption is the highest in Maharashtra, followed by Uttar Pradesh, Punjab and Haryana. On the other hand, per hectare consumption of pesticides was the highest in Punjab (0.74 kg), followed by Haryana (0.62 kg) and Maharashtra (0.57 kg) during 2016-17. Following graph shows pesticides consumption trends in India:
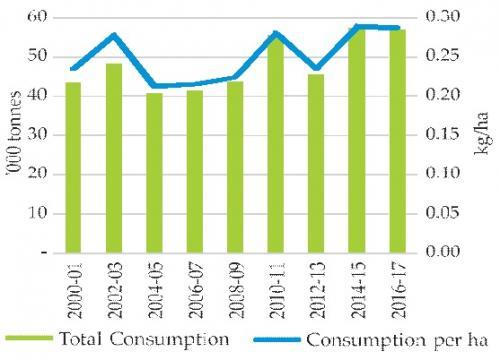
Graph: VIII: Trends in pesticide consumption in India
Source: Ministry of Chemicals and Fertilisers, ICAR – NAIP
Due to over dependence and indiscriminate use of insecticides, many ill-effects including residue in plant parts, resistance to insecticides, secondary pest out-break, pollution to natural resources, health complications for human and wildlife etc., warrant to switch over to eco-friendly pest management methods.
One of the critical challenges for a country’s food security is climate change and its impact in form of extreme weather events. The predicted 1-2.5 degrees Celsius temperature rise by 2030 is likely to show serious effects on crop yields. High temperatures may reduce crop duration, permit changes in photosynthesis, escalate crop respiration rates and influence pest population.
Climate change accelerates nutrient mineralisation, hampers fertilizer use efficiency (FUE) and hastens the evapotranspiration in soil.
The impact of climate change is directly or indirectly related to crop, water and soil as it influences the water availability, changes the intensity and frequencies of drought, effects microbial population, soil organic matter reduction, yield reduction, depletion of soil fertility as driven by soil erosion, etc.
An economic survey in 2017-18 cautioned that “climate change might be reducing annual agriculture income in the range of 15 per cent to 18 per cent and up to 20 per cent to 25 per cent for unirrigated areas”. This creates food shortages, nutrient deficiencies in humans due to inadequate intake of healthy food makes humans vulnerable to health issues.
Situation Assessment of Agriculture Households and Landholdings of Households in Rural India, 2019 reveals that more than half of India’s agricultural households were in debt, with an average outstanding of Rs 74,121. At all India level, about 60% of the outstanding loans were taken from Institutional sources which included Government (21%), co-operative Society (14.8%) and banks (42.9%). The debt burden can be attributed to increasing costs particularly on the inputs like fertilisers and pesticides.
In rural communities, agriculture and allied sector is the primary source of livelihood that includes 80 percent of all economically active women, out of which 33 percent constitute agricultural labour force and 48 percent are self-employed farmers. Rural women are engaged at all levels of agricultural value chain; i.e., production- pre-harvest, post-harvest processing, packaging, marketing to increase productivity in agriculture.
In 2016, the average age of an Indian farmer was 50.1 years, according to the Input Survey 2011-12 (released in 2016) by the Union Ministry of Agriculture and Farmers’ Welfare. According to this survey, the maximum number of operational land holders (33.7 per cent), belonged to the age group of 41-50 years, followed by 33.2 per cent in the age group of 51-60 years. Attracting rural youth and retaining them is critical challenge for sustaining agriculture.
All these factors need to be addressed in a comprehensive way to bring sustainability in agriculture. This needs paradigm shift in thinking and practices. Natural farming offers potential solutions to address these issues.
Natural Farming, as the name suggests, is the art, practice and, increasingly, the science of working with nature to achieve much more with less. It relies more on soil biology than soil chemistry by encouraging multi cropping, round-the-year soil cover, addition of formulation made up of cow dung and urines to trigger the microorganisms in the soil system.
Natural Farming is a chemical-free traditional farming method. It is considered as an agroecology based diversified farming system which integrates crops, trees and livestock with functional biodiversity. Natural farming is also referred to as “the natural way of farming” through ecological farming approach. It is considered as a cost- effective farming practice with scope for raising employment and rural development.
Globally, natural farming is considered as part of agro ecology. UN agencies like FAO, UNEP etc considers natural farming as an integral part of agro ecology.
Natural Farming has many indigenous forms in India, the most popular one is practised in Andhra Pradesh. The practice has also spread, in other forms, to other states, especially those in southern India. It is promoted as ‘Bharatiya Prakritik Krishi Paddhati’ (BPKP) under the centrally sponsored scheme Paramparagat Krishi Vikas Yojana (PKVY). BPKP aims at promoting traditional indigenous practices— which are largely based on on-farm biomass recycling with an emphasis on mulching and use of cow dung and urine formulations. It excludes all synthetic chemical inputs. Currently several states are undertaking Natural farming through central programmes like RKVY, PKVY, BPKP and others state specific programmes.
In the past few years natural farming in India has transitioned from a gross root movement in many states to scaling up stage across India. Andhra Pradesh, Himachal Pradesh, Gujarat, Haryana, Karntaka and Kerala are implementing natural farming on a considerable scale. Across India more than six million farmers are adopted natural farming. Almost all types of crops viz cereals, millets, cotton, fruits, vegetables and spices are being cultivated under natural farming.
Natural Farming offers a solution to various problems, such as food insecurity, farmers’ distress, and health problems arising due to pesticide and fertilizer residue in food and water, global warming, climate change and natural calamities. It also has the potential to generate employment, thereby stemming the migration of rural youth. The following are the details of the benefits of natural farming:
- Improvement in yields:
Natural farming aims to increase yields by maximizing production factors like labour, soil, equipment and by avoiding the use of non-natural inputs like fertilizers, herbicides and pesticides.
Natural farming advocates the cultivation of diverse species of crops depending on site-specific agro-climatic conditions. With the help of diversified/mixed cropping practices, farmers can harvest different types of produce at regular interval from small parcels of land and earn regular incomes. The mixed cropping system also improves the nutritional value of soil, minimizes risks, reduces pest loads, boosts productivity levels and ensures financial sustainability.
Independent Assessment in Crop Cutting Experiments by Centre for Economics and Social Studies (CESS) / I.D.S has been done for 6 seasons till now – 2018-19 (2 seasons) and 2019 – 20 (2 seasons), Kharif 2020 and Rabi 2020-21 (2 seasons). It was observed that the Yield differences are not significant between NF and Non-NF farms:
| Yield (Qtls/ Ha.) | Paid-out-cost (Rs/Ha.) | Net Income (Rs/Ha.) | |||||
| Crop | APCNF* | Non-APCNF $ | APCNF | Non-APCNF | APCNF | Non-APCNF | Changes in net incomes in % |
| Paddy (rice) | 53.95 | 51.75 | 46,125 | 61,301 | 53,168 | 33,392 | 59% |
| Groundnut | 22.12 | 19.59 | 46,540 | 48,448 | 49,899 | 20,603 | 142% |
| Cotton | 12.45 | 10.96 | 35,797 | 49,952 | 27,834 | 5,670 | 391% |
| Black Gram | 9.86 | 11.27 | 17,705 | 25,186 | 58,467 | 26,973 | 117% |
| Red Gram | 7.42 | 7.33 | 13,305 | 23,489 | 53,439 | 11,199 | 377% |
| Ragi (millet) | 18.56 | 12.27 | 23,840 | 36,947 | 38,396 | 4,673 | 722% |
Table – II: Yield data of Kharif 2020
Source: Independent Assessment in Crop Cutting Experiments by Centre for Economics and Social Studies (CESS) / I.D.S
| Yield (Qtls/ Ha.) | Paid-out-cost (Rs/Ha.) | Net Income (Rs/Ha.) | |||||
| Crop | APCNF* | Non-APCNF $ | APCNF | Non-APCNF | APCNF | Non-APCNF | Changes in net incomes % |
| Paddy (rice) | 62.56 | 57.11 | 43,760 | 52,029 | 61,207 | 38,782 | 58% |
| Groundnut | 36.23 | 25.61 | 39,929 | 57,143 | 1,68,286 | 73,494 | 129% |
| Black Gram | 12.97 | 13.05 | 18,246 | 25,714 | 66,590 | 58,576 | 14% |
| Maize (corn) | 75.86 | 63.01 | 39,819 | 43,598 | 79,191 | 49,524 | 60% |
| Green Gram | 12.64 | 10.27 | 19,310 | 26,692 | 58,609 | 36,128 | 62% |
Table – III: Yield data of Rabi: 2020-21
Source: Independent Assessment in Crop Cutting Experiments by Centre for Economics and Social Studies (CESS) / I.D.S
- Reduction in cost of cultivation and Increase in Farmer’s Income:
Natural Farming aims to drastically cut down production costs by encouraging farmers to prepare essential nutrients and plant protection materials with locally available resources, thereby ending the need for external and commercial inputs like fertilizers and other chemicals. The inputs like Jivamrit and Beejamrit are significantly reducing the costs of cultivation.
As per the report of Centre for Study of Science, Technology and Policy in Andhra Pradesh on ‘Life Cycle Assessment of Natural Farming (NF) and Non-NF’, fertilizer’s contribution to materials cost is 10%–20% in NF viz-a-viz 50%–70% in non-NF Overall of cost of cultivation is lower in NF than in non-NF for paddy, maize, and groundnut.
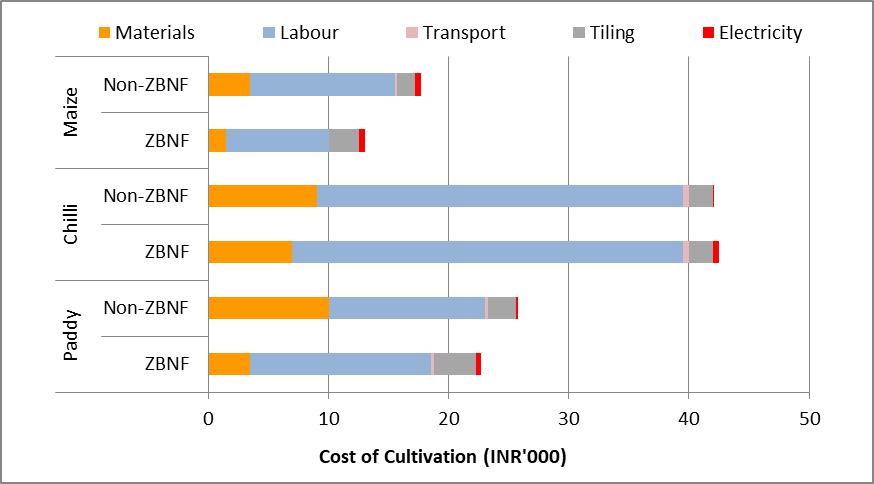
Graph: IX: Cost of cultivation ZBNF Vs Non – ZBNF
Source: C-STEP, Bangalore, Life cycle assessment of Natural Faming and Non-Natural Farming
Study by Council on Energy, Environment and Water (CEEW) have observed that farmers cultivating rice using chemical inputs spend INR 5,961 per acre on average, while one using NF techniques incurred INR 846 per acre on natural inputs. A similar pattern has been observed with respect to maize and groundnut cultivation. For maize, Natural Farming farmers spent INR 503 per acre on natural inputs whereas chemical farmers, on average, spent INR 7,509 per acre. For groundnut, a chemical farmer spent INR 1,187 per acre as against INR 780 per acre by a Natural Farming farmer.
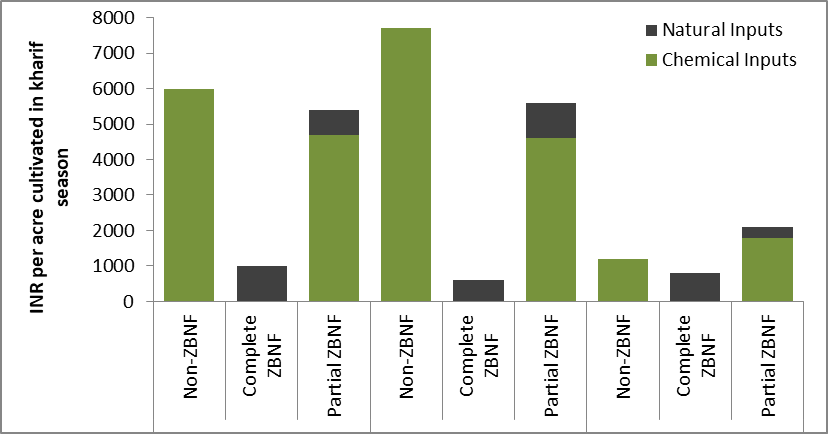
Graph – X: Average costs on inputs by Natural Farming vs Non-Natural Farming
Source: CEEW, study on Natural Farming
- Ensuring better health:
Fertilizers and pesticides have been shown to have adverse impacts on farmers as well as consumers. Farmers are exposed to contaminants while applying chemical inputs. By replacing such external inputs with locally made natural concoctions, inoculums, and decoctions, natural farming can reduce the incidence of non-communicable diseases, such as acute and chronic neurotoxicity, respiratory diseases and even cancer, which are associated with the use and application of inorganic chemicals in agriculture. Discontinuing chemical pesticides and fertilizers in fields will prevent run-off into water sources, further reducing communities’ exposure to such chemicals.
Chemical residue such as nitrate is almost undetectable in Natural Farming produce. A research study on ‘Assessment of Post NF effects on the Health and Nutrition Profile of Households’ through interviewing 570 households spread across 8 pilot districts and 19 clusters of Andhra Pradesh revealed that almost 80% of the NF families have experienced improvement in gastric problems, Hypertension and Diabetes post NF consumption. All the NF households revealed improvement in stamina and improvement of health in their infants post NF consumption.

Graph – XI: Impact of ZNBF on health
Source: Assessment of Post NF effects on the Health & Nutrition profile of households (December 2019)
- Reduction in Chemical Fertilisers:
The indiscriminate use of chemical fertilizers and pesticides is a threat to soil and environment. This has adversely impacted the crop response ratio and created an imbalance of nutrients in the soil. The crop response ratio has reduced from 58 percent in the last six decades. The ideal ratio of the three major plant nutrients, Nitrogen, Phosphorous, and Potassium of 4:2:1 is disrupted.
A report by CEEW states that Non-Zero Budget Natural Farming (ZBNF) farmers use three times more urea and DAP per acre than ZBNF farmers. It also highlights that farmer practicing rice cultivation using ZBNF can avoid 83–99 percent of various fertilizers consumption. The expected urea use for ZBNF rice farmers is 0.59 kilograms per acre (kg/acre) and for non-ZBNF farmers is 74.46 kg/acre, resulting in 73.87 kg/acre of avoided urea consumption.
The fertilizers that can be avoided through ZBNF are mentioned below:
| Crop | % of reduction in usage by Natural Farming farmer- Urea | % of reduction in usage by Natural Farming farmer- DAP | % of reduction in usage by Natural Farming farmer- SSP | % of reduction in usage by Natural Farming farmer- MOP | % of reduction in usage by Natural Farming farmer- Complex |
| Rice | 99.2 | 98.4 | 82.8 | 99.8 | 90.3 |
| Ground nut | 69.4 | 90.4 | 58.3 | 47.6 | 44.3 |
| Maize | 84.8 | 78.4 | 79.7 | 24.6 | 67.3 |
Table: IV: % of reduction in chemical fertilisers by Natural Farming farmers
Source: CEEW – “Can Zero Budget Natural Farming Save Input Costs and Fertiliser Subsidies- Evidence from Andhra Pradesh”)
- Reduction in water consumption:
Natural Farming is a pre-eminent practice that has proved to improve water retention capacity. It requires minimum water consumption and is known to reduce the dependency on resources like water and electricity. Thus, ultimately preserving groundwater reserve, improve water table, and reduce financial and labor stress on farmers. Practices like Whapasa have a positive effect in improving fertility and improving water retention capacity of soil. Similarly, contours and bunds preserve rainwater and allow soil moisture to retain for a longer period.
Essentially, Natural Farming helps in making soil porous and increases the moisture content in the soil since the amount of water in the air is 10 times that of the amount of water in rivers.
The reduction in water consumption by paddy in Zero Budget Natural Farming (NF) is evident in a study by Centre for study of Science, Technology and Policy conducted in Andhra Pradesh on Life Cycle Assessment of NF and Non-NF. It was found that for paddy, NF requires 1,400 thousand liters as per theory and 3,500 thousand liters as per the survey, (average per acre) less water than non-NF.
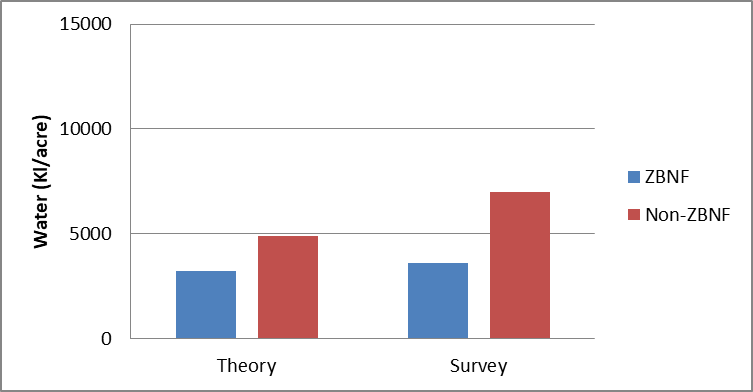
Graph-XII: Water consumption by Natural Farming vs Non-Natural Farming for Paddy
Source: C STEP – Life cycle study of Natural Farming and Non-Natural Farming
- Climate change resilience:
Natural Farming practices are resilient to climate change. The practices promoted under Natural Farming are potential to adopt to climate change and mitigate climate change. Practices such as multi cropping, integration of trees, mulching are potential to adopt to climate change while practices like dung-based inoculants and avoiding chemical fertilisers and pesticides are potential to mitigate climate change.
Way forward for promotion for natural farming:
Scaling up of natural farming needs innovative community-based platforms. Natural farming needs community adoption, it may not successful if few people adopt in a village. Whole village approach is required to harvest the benefits of natural farming. SHGs has a proven track record for implementing Non-Pesticide Management (NPM), Community Managed Sustainable Agriculture (CMSA) and Agro Ecological Practices (AEP). SHGs are the best platform for promotion of Natural Farming. SHGs and their federations have extension workers (Community Resource Persons) at village level and they can play an important role transforming the villages into natural farming villages.
Jayaram Killi is presently National Mission Manager, DAY-NRLM, MoRD, GOI. Earlier he woked as Director, Livelihoods at Mahila Abhivruddhi Society, Andhra Pradesh (APMAS). He was responsible for design and development of livelihoods strategy of the organisation and manage livelihoods projects.
He has also served as member of core team on Agriculture for Andhra Pradesh Drought Mitigation Project, National Resource Person for National Rural Livelihoods Mission. He served as expert committee member for Review the proposals for Mahila Kisan Saskthikaran Pariyojana.
As Expert, FPO development he provided oversight and management of the promotion and strengthening of Farmer Producer Organisations (FPOs).
He has vast experience in scaling up of innovations in agriculture. He handled large scale projects like “Community Managed Sustainable Agriculture (CMSA)” in Andhra Pradesh, Mahila Kisan Sashktikaran Pariyojana (MKSP).
He has promoted and sustained many Information and Communication Technology (ICT) innovations in extension for agricultural and rural development.
He promoted partnerships with corporate agencies, research agencies and NGOs.
He has vast experience in working with World Bank, State Rural Livelihoods Missions, ICRISAT, Corporate agencies like walmart, ITC, Mahindra and Mahindra, research institutions like IISc, CRIDA, and government agencies like CESS, NRLM and NIRD to support and strengthen various initiatives.
Domains of expertise: Sustainable Agriculture, Partnership building with research and corporate sectors, MIS, Design and Implementation of Rural Livelihoods Programs, Natural Resource Management, Agri-Business Management & Value Chain development.